

Mapping Out What’s Next for the Marshall Islands

For residents of the Marshall Islands, a system of over a thousand islands found on 29 small atolls in the middle of the Pacific Ocean, sea level rise is already an existential threat. Extreme high tides (called king tides) once a rarity, now hit some of the islands up to five times a year, flooding homes and washing away the little bits of land that peek up above sea level. It may be surprising then, that until recently, an accurate map of the islands’ topography, or its height relative to sea level, did not exist.
“Until now the data that existed for that area had an accuracy of meters, and not one meter but six to eight meters. That is practically unusable,” says Monica Palaseanu-Lovejoy, lead scientist with the United States Geological Survey (USGS).
In 2016, Palasseanu-Lovejoy and a team of scientists from several institutions set out to fix this information gap using a new method for creating highly accurate topographic maps. Armed with survey grade GPS equipment and two Phantom quadcopter drones, they crisscrossed the capital atoll of Majuro capturing high-resolution aerial photographs and then linking the position of those images to specific GPS coordinates to derive accurate elevation information.
In the past, creating high-resolution topographic maps required the use of light detection and ranging or LIDAR. LIDAR measurements come from a laser light that measures distance and are usually made from small planes like a Cessna, a task that is both inherently dangerous and extremely expensive. Another option includes using imagery from satellites, but this option has a low-resolution, with each pixel being equivalent to roughly the size of a baseball diamond.
But research funded by the Pacific Islands Climate Adaptation Center (PI-CASC) in collaboration with the University of Guamrevealed that a drone could accomplish the same task as planes for a fraction of the cost, all while keeping the scientists safely on the ground. After successful pilot projects mapping a portion of the coast of Oahu, Hawaii, the PI-CASC turned to the USGS for their expertise in topography modeling. Together with the National Oceanic and Atmospheric Administration (NOAA), the University of Hawaii, and the University of Guam, they turned their focus to the Marshall Islands—an area of the world that greatly needed elevation data to help mitigate the effects of sea level rise.
“This project really was the first of its kind,” says Jeff Danielson from the USGS. “The people out there (the Marshallese) were just crying out for this data.”
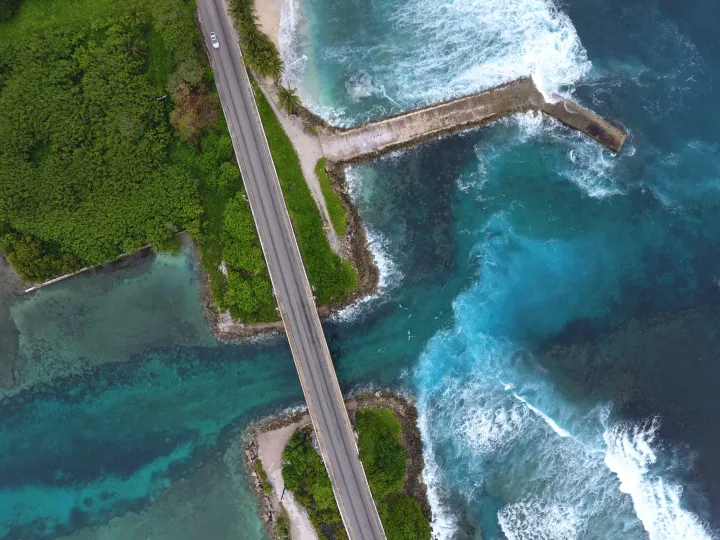
Majuro is a small atoll island of only 3.5 square miles (9 square km) and a maximum elevation of roughly 10 feet (3 m). The small islands that peek above the sea surface in a ring are a remnant of an old volcano. As Darwin first hypothesized, volcanoes emerging from tropical waters are colonized by corals over thousands of years. Year after year the corals build on top of one another until they break the water’s surface, while eventually, the volcano in the center begins to sink below the surface. Ultimately all one sees is a lagoon surrounded by a ring of islands, which are formed as the corals die at the surface and pile up, leaving behind limestone skeletons that eventually turn to sand. Majuro Atoll’s diameter is roughly 29 miles (46 km) at its most distant points, but the thin ring of land is on average only 330 to 490 feet (100 to 150 m) wide and just 98 feet (30 m) wide at its narrowest. This is the land (together with other atolls in the region) that the Marshallese call home.
But in recent years, the people living here have noticed changes to the land because of sea level rise. The island cemeteries, once sheltered from the waves, now get flooded during the highest tides, and after storms exposed bones wash ashore. Roots from some of the oldest trees, once completely covered in sand, now appear above ground in a knobby tangle. And the fresh water supplies people depend on are now regularly contaminated by seawater.
For the Marshallese, whose culture and identity is heavily tied to their land, leaving is not an option, at least not yet. And so, understanding and preparing for the inevitable increase in sea level is imperative. This is where the topographic map comes into play. With an accurate map in hand, the Marshallese can evaluate where flooding might occur for any specified increase in sea level and then plan changes to building structures and new developments accordingly.
Once the scientists landed on Majuro, the first step was to assign GPS coordinates to specific points across the island. With a survey grade GPS attached to a car, the scientists drove at a slow crawl across every road on the island (and some remote “roads” that bordered on glorified paths of sand), taking a GPS coordinate at every meter. The GPS requires a speed of between 10 and 15 mph, which for most roads would cause a traffic jam. Luckily, on Majuro, this is the normal speed limit. Where a car could not navigate, like along the shoreline, the GPS was attached to a backpack and the scientists trekked along the farthest reaches of the sand at low tide. Not only did the GPS connect to at least eight satellites to obtain its position, it also communicated witha designated GPS base station on the island for verification and correction, all efforts to get the most accurate data. In total, over 100,000 GPS points were mapped.
The next step required the drone. Similar to the zig-zag pattern used to mow a lawn, the drone flew back and forth over every inch of the island taking snapshot after snapshot. Each image overlapped both the one immediately preceding and the image immediately following so that later computer software could stitch the photos together and create a seamless 3D image of the ground.
Despite the comparative ease of using a drone, the team ran into a few issues during their project that required some quick thinking. For one there was the airport. Aviation regulations state that a drone cannot fly within five miles of an international airport, and the drone even has programming that recognizes when it is within this radius and shuts down its flying capabilities.
“You realize that the whole atoll is within five miles of an airport?” says Palaseanu-Lovejoy.
Special permission from the airport and an override code provided by the drone’s company should have fixed the issue, but the team soon realized that once they tried to fly on airport property the drone refused to fly. This realization occurred midflight and over the ocean. Luckily, pilot Matt Barbee from the University of Hawaii figured out how to bring the drone back to safety by taking advantage of the few seconds before the drone connects to GPS during its boot up process.
In isolation, the imagery provided by the drone is useless. This is where the GPS points become critical. Key to creating the final map was white and black cross targets placed on the ground at designated GPS points. As long as one of these targets was visible to the drone’s camera the GPS grid could be linked to the drone imagery and the 3D image could be accurately placed in its correct geographical space on the surface of the Earth.
Although a drone camera is perfect for capturing the above water landscape, once it hits the ocean this method becomes useless for mapping the ocean floor. In deep water, large research vessels are able to use SONAR pings to map the seafloor, but for this project, the scientists wanted to map the shallow water right next to the coast in order to create a seamless map. Luckily, the ocean water by the Marshall Islands is so clear that satellite cameras can view through the water down to the seafloor. Instead of taking a normal photograph using the entire visible spectrum of light, the researchers snapped images using very specific wavelengths. For this project, the specific wavelengths, also called bands, were green, blue, red, and blue-violet. Using this method, each pixel provides a corresponding numerical value and in isolation, the pixels provide a jumble of nonsensical numbers. But in this case, a prior research expedition mapped a portion of the deeper coastline using LIDAR and, like the Rosetta stone, this information provided the key to the code. By first matching the known LIDAR depths to the satellite imagery values the scientists were able to figure out the depth of the entire coastline using only the colored photographs.
Finally, after synthesizing all the collected data—the GPS points, the drone images, the satellite photographs, and the collection of old seafloor data from previous expeditions—an accurate map took shape. Now, the topographic elevation on the island is pinpointed within an accuracy of 8 inches (20 cm).
“It really was a creative way to use the best possible data we could get our hands on to make this seamless model,” says Danielson. “This is by far the best model produced for the island of Majuro.”
With a completed elevation model, the scientists are now looking to project what areas will be flooded in different sea level rise and storm scenarios. According to Dean Gesch, an expert on sea level rise impact assessment at the USGS and a member of the project, this will be critical for planning new construction or modifying buildings in the lowest lying areas of the island. Although sea level rise is a daunting issue, perhaps, with a little planning, the Marshallese can prepare for a future with higher seas and continue living on the islands they call home.