

El Niño Explained: Understanding the Forces Shaping 2023-24 Winter Weather

Reviewed by Michelle L’Heureux, NOAA Climate Prediction Center
Climate experts have their expectations set for a “strong El Niño event” for the upcoming 2023-24 winter. El Niño refers to the natural climate system that appears intermittently every 2 to 7 years and has widespread effects across the globe, impacting everything from local weather to fisheries to international tourism. Here, we answer fundamental questions about how El Niño develops, how scientists make predictions about it, and how it causes unusual effects.
What is El Niño?
El Niño, Spanish for “little boy,” is a climate pattern that involves the unusual warming of surface waters in the eastern Pacific Ocean. As opposed to short-term weather events, climate events like El Niño are longer term environmental conditions that last months or even years. El Niño is the “warm phase” of a larger phenomenon called the El Niño Southern Oscillation (ENSO), with La Niña (“little girl”) as the “cool phase” alternative measured by unusual cooling in the eastern Pacific Ocean. El Niño is the most dramatic year-to-year variation of the earth’s climate. The origins of ENSO are not yet fully understood, given the complexity of ocean-atmosphere interactions on a global scale.
How do small changes in the Pacific Ocean lead to global effects?
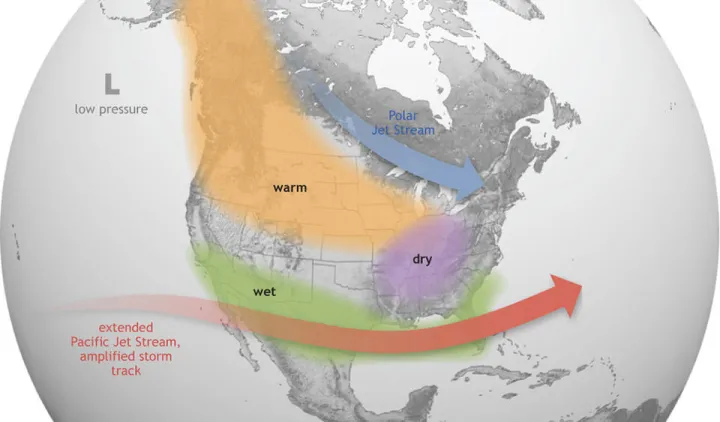
El Niño is essentially a chain reaction, beginning in the equatorial Pacific Ocean and extending around the globe. In climate science, or climatology, this broad web of effects is called “teleconnections.” Normally, the trade winds reliably blow from east to west across the tropical Pacific, which pushes the warm surface water toward Indonesia and away from equatorial South America. Along the South American coast, cool water rises from the deep ocean to replace the warm water. An El Niño pattern begins with the weakening of the trade winds. With weakened trade winds come changes in air pressure and wind speeds, which push warm water toward the west coast of South America. As a result of the warmer water, there is more rising motion and the surface atmospheric pressure in the eastern Pacific drops. At higher latitudes, these changes in the tropics allow the Pacific Jet Stream, a narrow current of air flowing from west to east, to be pushed south and spread further east. The jet stream steers weather systems, thereby determining the weather patterns seen across a wide geographic range.
How can scientists predict El Niño events?
El Niño and La Niña are classified by precise measurements of the water temperatures in the east-central equatorial Pacific Ocean. El Niño events occur when there is a temperature increase of at least 0.5 degrees Celsius across five overlapping three-month periods. These temperature measurements are taken by National Oceanic and Atmospheric Administration (NOAA) buoys equipped with thermometers, which are in about 70 locations. El Niño events can also be anticipated via National Aeronautics and Space Administration (NASA) satellite measurements that detect sea surface height (the ocean height rises as temperatures warm up, since warmer water expands to fill more volume). Scientists then use the Oceanic Niño Index to measure deviations from normal sea surface temperature. The higher the temperature changes, the “stronger” the El Niño, according to the Oceanic Niño Index. Informally, a 0.5–0.9 degree Celsius change equates to a weak El Niño, a 1.0–1.4 degree Celsius change moderate, above 1.5 degrees Celsius for a strong El Niño, and over 2.0 degrees Celsius for a “historically strong” effect.
What are the predictions for 2023?
According to the Climate Prediction Center, the temperature in the Pacific Ocean for the August-October season has been around 1.5 degrees higher than the historical average, and it is expected that this year’s El Niño event will likely be strong. This comes after three consecutive La Niña winters. According to a Nov. 9 diagnosis from the Climate Prediction Center, a division of the National Weather Service, there is a greater than 55 percent chance of at least a “strong” El Niño from January through March 2024, and a 35 percent chance that this event will be “historically strong” for the November to January season. There is also a 62 percent chance that at least a weak El Niño will continue through April, May, or June 2024. However, experts remind us that a strong El Niño does not necessarily mean stronger effects but rather increases confidence in seeing the expected impacts associated with El Niño.
How does El Niño affect the weather?
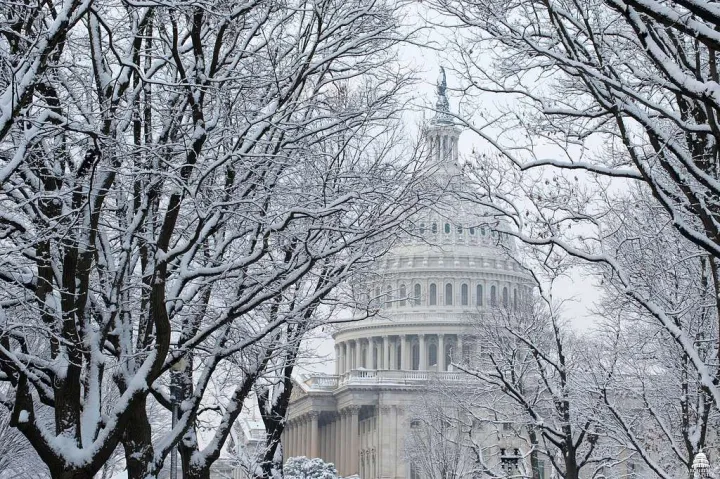
Since El Niño shifts the Pacific jet stream, it also shifts which regions end up warmer or cooler, rainier, snowier or drier. But translating climate patterns into local weather is difficult because there is so much variability; no two El Niño events are exactly alike. Scientists typically look at historical data to figure out what is most likely to happen. Generally, El Niño events lead to more rain and flooding in coastal Ecuador and Peru and eastern Africa, while causing drought in Indonesia, Australia, and northern South America, over the Ohio/Tennessee valleys, and the Pacific Northwest. Canada tends to become warmer than usual, while the southeastern U.S. is either near-average or colder and experiences more precipitation. This year, scientists predict that the higher precipitation in the mid-Atlantic which, when timed with cold air outbreaks, could lead to above-average snowfall in places like D.C. and Baltimore.
How does El Niño affect marine life?
The changes in ocean surface temperature can have significant effects on marine life. According to NOAA fisheries, a big consequence of El Niño is a loss of commercially important species where they traditionally occur. In fact, the name “El Niño” was first coined by South American fishermen in the 1600s when they noticed lower abundance of fish during certain warmer years. The warmer Pacific surface water along the South American coast can drive certain fish species away from their normal range toward colder water. But while warmer temperatures drive away some fishery species like anchovy off the coast of Peru, it can also bring tropical species like yellowtail and albacore tuna into areas that are usually too cold. South American fishermen in the 1600s when they noticed lower abundance of fish during certain warmer years. The warmer Pacific surface water along the South American coast can drive certain fish species away from their normal range toward colder water. But while warmer temperatures drive away some fishery species like anchovy off the coast of Peru, it can also bring tropical species like yellowtail and albacore tuna into areas that are usually too cold.
In addition to the direct temperature changes, the reduction in trade winds also allows warm water to drift back toward the South American coast and reduces the process of “upwelling”. Upwelling brings up cold, nutrient-rich water from the lower layers of the ocean to the surface, where trade winds pushed away warmer water. Upwelling provides necessary nutrients for phytoplankton. Without upwelling, there are little to no phytoplankton, which means the ecosystem can no longer support the same productivity, resulting in ecosystem-wide effects.
Is El Niño impacted by climate change?
Recent research shows that global warming due to climate change has led to more frequent and more intense El Niño events. According to one climate scientist, extreme El Niño and La Niña events may increase in frequency from one in every 20 years to one in every 10 years by the end of the 21st century. Meanwhile, the effects of climate change can be amplified by El Niño and La Niña events. For instance, excessive coral bleaching was observed during the 2015-16 El Niño. But the exact effects will be seen in the coming years.
Ultimately, El Niño is a key player in the Earth’s climatic regulation. While there is still a lot to understand about the powerful global pattern, the knowledge we do have can allow us to plan for the weather patterns we are likely to observe this year.