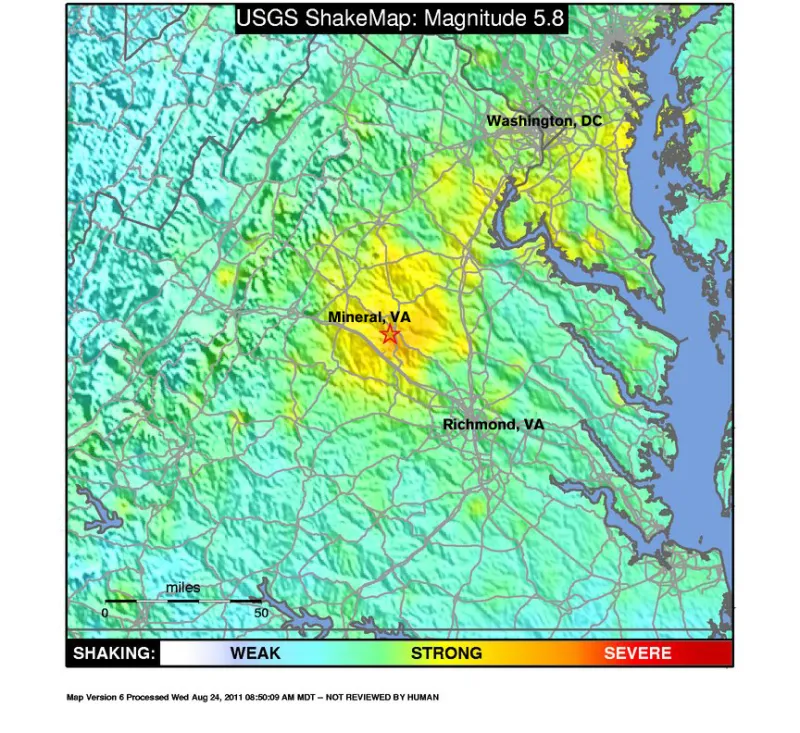
Map of the Magnitude 5.8 Virginia Earthquake of 2011

On August 23, 2011 a magnitude 5.8 earthquake struck the East Coast of the United States. The earthquake map shown here, generated by the U.S. Geological Survey and regional seismic network operators, shows the ground motion intensity that followed the earthquake. These maps are used for earthquake response, recovery, preparation, and planning.
Dr. Elizabeth Cottrell, a geologist with the Smithsonian National Museum of Natural History, puts the Virginia earthquake into context, explaining why it was felt over such a large area, the geology behind this earthquake, and what is generally known about faults in Virginia. For information on classroom resources, read the Educators blog post on earthquake lesson plans.

